Hi Community, I am new to many things around here, and for this reason I’d need and appreciate some help from experienced people. For a project of mine which has nothing to do with GIS, I’d like to to render the digital elevation model of a geographic region with combined Hill-Shading and PseudoColors, same as in QGIS. Here there is what I’m aiming to (min 2 to 3.40): https://www.youtube.com/watch?v=EMwPT7tABCg&list=PLC_fQYHjsTR3XMlwj2wDwv0B1ycaAW9S7
Not even ChatGPT can help me out with this? Can anyone suggest the pathway? Thanks in advance
Hi Marco welcome to the forum!
Below is a screenshot of what I think you’re trying to achieve?
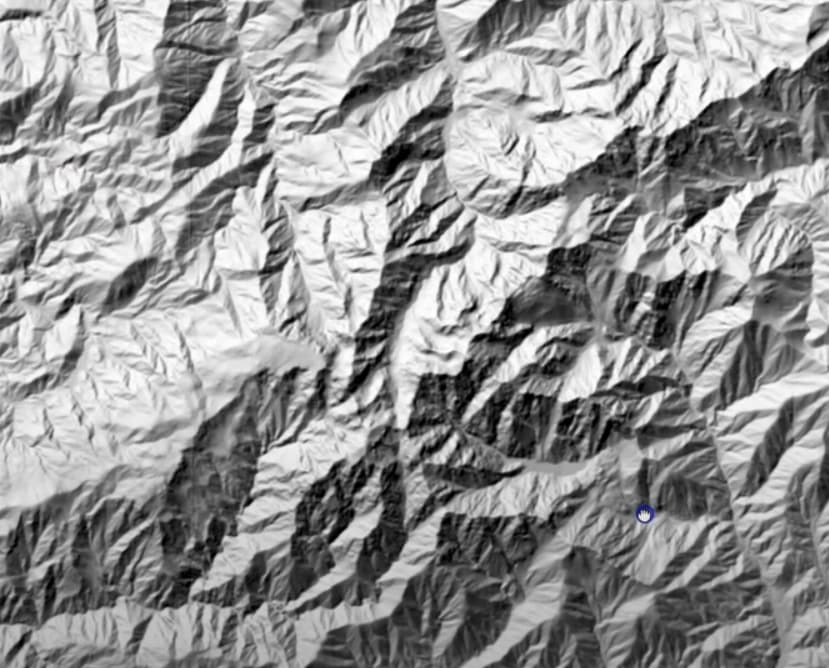
For something like this (generating an interactive graphic representation of some data) my first guess would be using PyQtGraph. This is a plotting interface which can accept Python data structures like numpy arrays and render them into Qt’s QGraphicsView.
For the image shown it would depend on the source data you have. If you have a point-by-point array (similar to an image) you can render this as an image into the view. If you have polygons, you might want to use PColorMeshItem
If you can give some more details of your data structures I can have a further look.
There is of course also matplotlib (there’s a topographic hillshading example here) which you can embed in Qt applications.
Hi Martin, thanks for picking up my “distress” call on this. I realize now that I’ve missed to provide some important bit of information. The elevation data are read from a GeoTIFF file (raster data). Thus, the data are organized point-by-point or anyway they are not vector data. As for Matplotlib, I have tried it but I’ve soon got the impression it is not fast enough for my application, basically a moving map, where the map visualization must be updated once per second with the GPS coordinates and zoomed in and out reasonably quickly. Finally, the hillshading is a basic ingredient of the visualization type I am after but what I am aiming to is some kind of result like this:
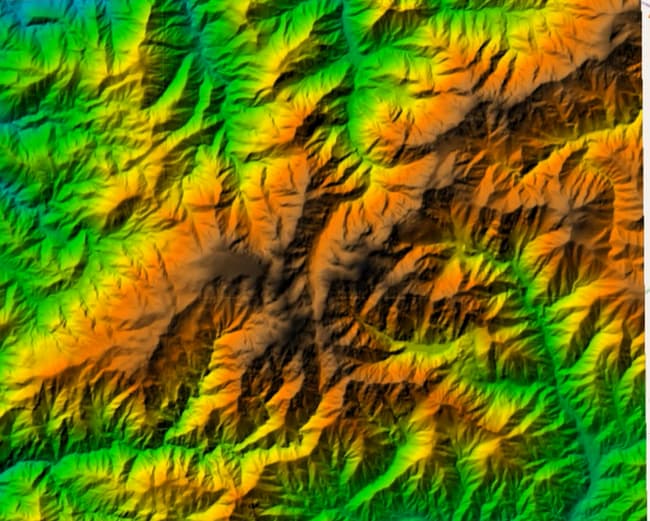
This rendering is obtained in QGIS by overlaying a pseudocolor layer representing the terrain elevation to the undelrlaying hillshading layer like the one of your screenshot. I hope it is possibile to obtain the same rendering by means of PyQtGraph. I will give a try to PyQtGraph and provide a feedback. Thanks. Marco