I’m following this tutorial on how to embed pyqtgraph in pyqt5.
I need to enable pyqtgraph to show cursor position. but i don’t know how to do that. please help me.
I’m following this tutorial on how to embed pyqtgraph in pyqt5.
I need to enable pyqtgraph to show cursor position. but i don’t know how to do that. please help me.
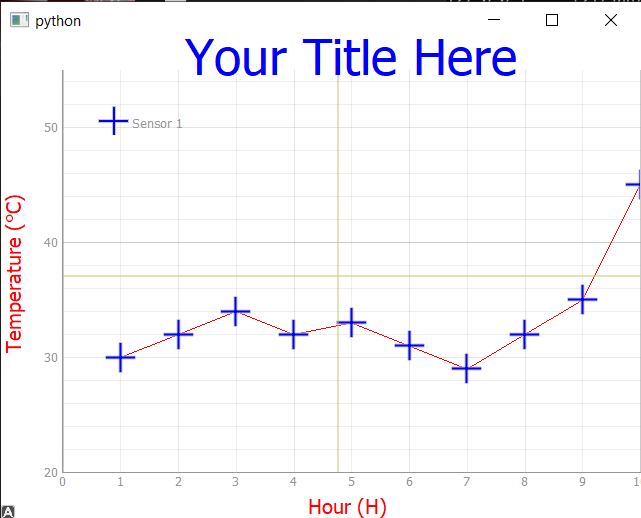
This is a little trickier than I expected, but I’ve got it figured out. You need to manually draw the crosshair yourself, and then update the position of those lines based on mouse movements using a signal proxy.
The code below is an updated version of the example on the site, adding the crosshair lines. The lines are drawn in the plot() method, and then updated in the mouseMoved method. See the SignalProxy which forwards mouse movements to this custom handler.
from PyQt5 import QtWidgets, QtCore
from pyqtgraph import PlotWidget, plot
import pyqtgraph as pg
import sys  # We need sys so that we can pass argv to QApplication
import os

class MainWindow(QtWidgets.QMainWindow):

    def __init__(self, *args, **kwargs):
        super(MainWindow, self).__init__(*args, **kwargs)

        self.graphWidget = pg.PlotWidget()
        self.setCentralWidget(self.graphWidget)

        hour = [1,2,3,4,5,6,7,8,9,10]
        temperature = [30,32,34,32,33,31,29,32,35,45]

        #Add Background colour to white
        self.graphWidget.setBackground('w')
        # Add Title
        self.graphWidget.setTitle("Your Title Here", color="b", size="30pt")
        # Add Axis Labels
        styles = {"color": "#f00", "font-size": "20px"}
        self.graphWidget.setLabel("left", "Temperature (°C)", **styles)
        self.graphWidget.setLabel("bottom", "Hour (H)", **styles)
        #Add legend
        self.graphWidget.addLegend()
        #Add grid
        self.graphWidget.showGrid(x=True, y=True)
        #Set Range
        self.graphWidget.setXRange(0, 10, padding=0)
        self.graphWidget.setYRange(20, 55, padding=0)

        pen = pg.mkPen(color=(255, 0, 0))
        self.graphWidget.plot(hour, temperature, name="Sensor 1",  pen=pen, symbol='+', symbolSize=30, symbolBrush=('b'))

        # Add crosshair lines.
        self.crosshair_v = pg.InfiniteLine(angle=90, movable=False)
        self.crosshair_h = pg.InfiniteLine(angle=0, movable=False)
        self.graphWidget.addItem(self.crosshair_v, ignoreBounds=True)
        self.graphWidget.addItem(self.crosshair_h, ignoreBounds=True)

        self.proxy = pg.SignalProxy(self.graphWidget.scene().sigMouseMoved, rateLimit=60, slot=self.mouseMoved)

    def mouseMoved(self, e):
        pos = e[0]
        if self.graphWidget.sceneBoundingRect().contains(pos):
            mousePoint = self.graphWidget.getPlotItem().vb.mapSceneToView(pos)
            self.crosshair_v.setPos(mousePoint.x())
            self.crosshair_h.setPos(mousePoint.y())


app = QtWidgets.QApplication(sys.argv)
main = MainWindow()
main.show()
sys.exit(app.exec_())